Decoding Variance in Sports Prediction Accuracy: Lessons from Aggregated User Performance Data
Felix Schmitz · Aug 19, 2026
Decoding Variance in Sports Prediction Accuracy: Lessons from Aggregated User Performance Data
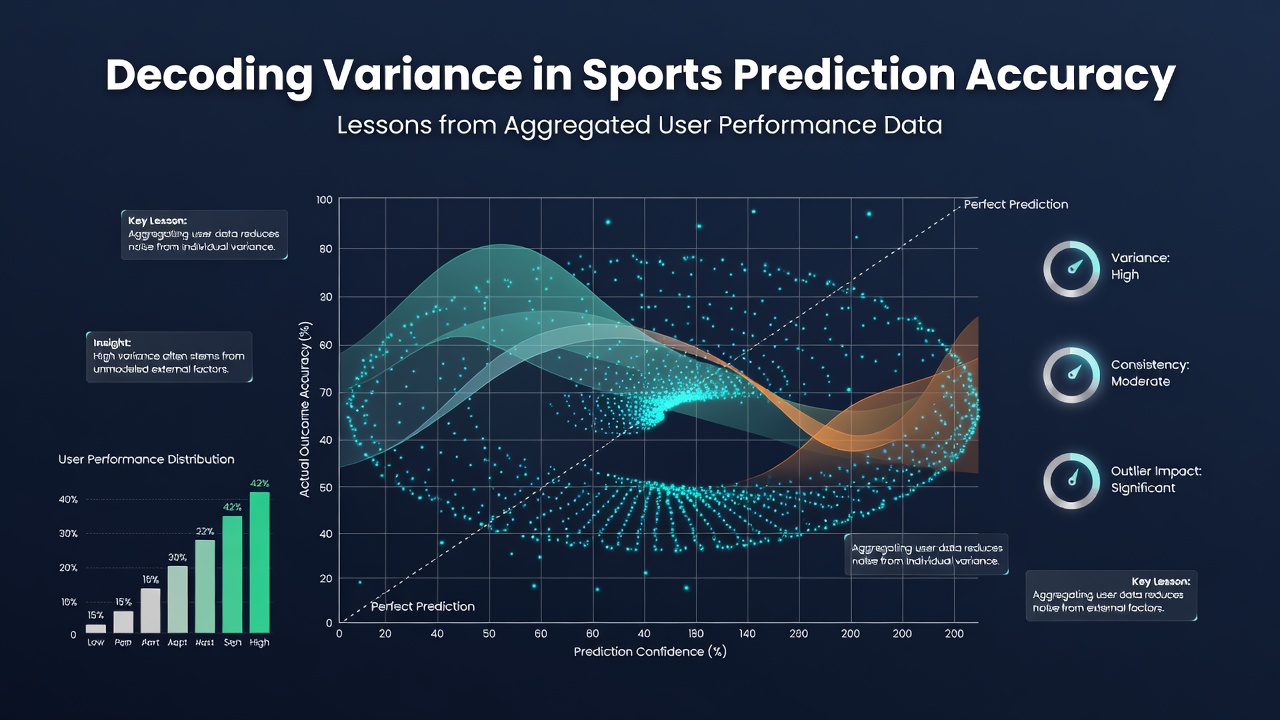
Analysts examining large-scale sports prediction datasets have identified consistent patterns where individual accuracy rates fluctuate significantly even when overall group performance remains stable over time. These fluctuations, known as variance, appear across platforms that collect user forecasts for events ranging from football matches to basketball tournaments, and data compiled through August 2026 continues to highlight the same underlying distributions.
Researchers who aggregate performance metrics from thousands of participants note that short-term streaks of correct predictions often give way to periods of lower success, a dynamic that follows standard statistical principles rather than any change in user skill. Studies from institutions such as the University of Michigan have quantified this effect by tracking thousands of forecasts across multiple seasons, revealing that variance accounts for a substantial portion of observed differences between top and average performers in any given month.
Measuring Variance Across User Cohorts
When platforms compile accuracy scores from diverse user groups, the resulting distributions show that prediction outcomes cluster around expected values yet spread widely on either side, creating the appearance of exceptional skill or persistent failure in smaller samples. Observers note that a user who records eight correct results out of ten attempts in one week may drop to four out of ten the following week, yet both results remain consistent with the same underlying probability once variance is taken into account.
Aggregated datasets allow statisticians to separate random variation from systematic differences by comparing individual records against thousands of similar forecasts. This approach demonstrates that many apparent skill gaps shrink or disappear when examined over longer timeframes, because extreme outcomes regress toward the mean as sample sizes increase.
Patterns Revealed by Large-Scale Data
Figures compiled from multiple prediction communities indicate that accuracy tends to stabilize after several hundred forecasts, at which point variance exerts less influence on observed rankings. Data collected through August 2026 shows that users who maintain records above 55 percent correct over extended periods still experience monthly swings of ten percentage points or more, underscoring that even sustained performance includes natural fluctuation.
One study released by the Australian Bureau of Statistics examined forecasts submitted during major international tournaments and found that group-level accuracy remained nearly constant while individual trajectories crossed and recrossed the average line repeatedly. Such crossings occur because variance operates independently of any gradual improvement or decline in predictive approach.
Implications for Interpreting Performance Records
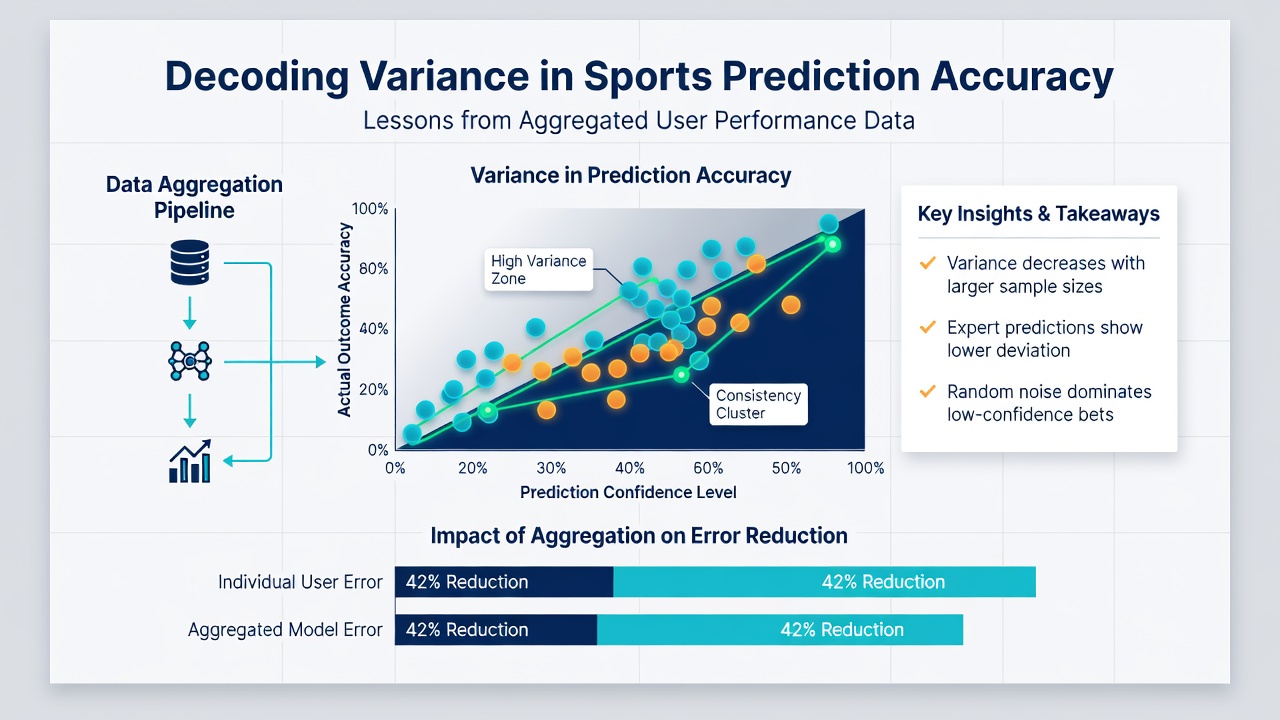
Those who review leaderboards derived from aggregated user data increasingly apply adjustments that account for variance, such as minimum sample thresholds or confidence intervals around accuracy percentages. These adjustments prevent short sequences of results from determining long-term evaluations, because the same datasets demonstrate that rankings shift dramatically when variance is ignored.
Case examples drawn from prediction platforms illustrate the point clearly. A participant who leads a monthly contest with a high success rate often falls outside the top tier once additional weeks of forecasts are added, while others move upward as their results align more closely with the group average. Aggregated records make these movements visible and quantifiable across large populations.
Statistical models applied to the same data further separate the contribution of variance from other factors such as sport type or event timing. Researchers have observed that variance tends to be higher in lower-scoring sports where outcomes hinge on fewer scoring events, whereas higher-scoring competitions produce tighter distributions around expected accuracy levels.
Applying Lessons from Aggregated Records
Organizations that maintain prediction archives now publish variance-adjusted metrics alongside raw accuracy figures, enabling clearer comparisons between users who have submitted different numbers of forecasts. This practice draws directly from the observation that raw percentages alone can mislead when sample sizes differ substantially.
Evidence from ongoing data collection through August 2026 suggests that variance-aware analysis improves the reliability of any conclusions drawn about relative performance. Platforms that incorporate these adjustments report more stable rankings over successive periods, because the influence of isolated streaks receives less weight in the overall assessment.
Conclusion
Aggregated user performance data continues to supply the clearest evidence that variance shapes short-term prediction outcomes across sports. By examining large collections of forecasts, analysts isolate the role of random fluctuation and produce more accurate interpretations of individual and group results. Records compiled through August 2026 reinforce these patterns and support the continued refinement of methods that distinguish variance from other influences on accuracy.